A 2D vector and scalar field plotter
Featuring:
- Line Integral Convolution (LIC) on the data.
- Curvilinear scaled arrows following the flow lines.
- Mixed mode: scalar field map with overlaid vector field.
- Missing data are handled and do not interfere with the flow lines.
- Generation of Scalable Vector Graphics (SVG) files, which are easily editable and convertible while preserving the best quality for inclusion in a PDF scientific article.
- The color palette is designed so the flows are uniformly readable when printed as grey scale.

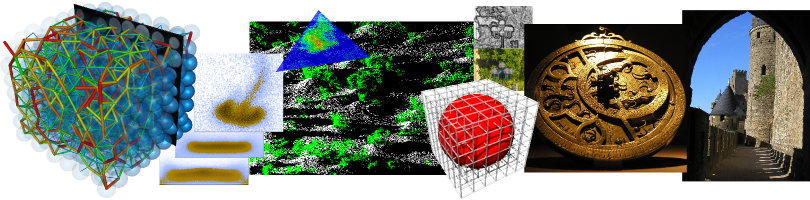
Example (provided with the program): temperature map with overlaid velocity field, in a granular flow.

The temperatures legend.
Download
Packages of vsfplot version 1.1 can be downloaded as tar.gz or zip formats.
Both contain the same files, including:
- The source code.
- A linux 64 bits statically compiled binary (no need for extra dependencies).
- A windows 32 bits vsfplot.exe (also statically compiled, no need for extra DLLs)
Linux/64 bits is the reference platform, from which I also cross-compiled the windows executable for your convenience. vsfplot is a free/libre software released under LGPL v2.1 or more recent.
Usage
"vsfplot data.txt test" produces two files: "test.svg" and "test_legend.svg", examples of which are displayed above.
# Comments starting with # are ignored, as well as blank lines
# Columns are by default in this order: x y vector_x vector_y scalar
# x and y values shall be specified at grid points, possibly with missing values.
0.05 0.25 0.0219881 0.0189318 0.953802
0.05 0.35 0.023919 0.0166145 1.04089
0.05 0.45 0.0241417 0.0153331 1.04686
...
You can specify which columns to use in case the file contains many colums. Vsfplot can display scalar maps as well (x, y, value), or a mixed mode with a vector field displayed on top of a scalar map (x, y, vx, vy, value). In the (x, y, vx, vy) 4-column mode, the scalar values are set to the vector norms. See the full usage below.
The output files are produced in Scalable Vector Graphics (SVG) format. You can easily convert these to any bitmap format (PNG, JPEG...), vector format (PS, PDF...), edit these files (including extracting the images or changing the arrows, etc.) using the excellent free/libre software Inkscape. Vector formats are preferred for better quality in scientific articles.
vsfplot [--options args ...] data_file output_base_name

Options can be specified in any order:
  -d [ --data ] arg         The data file, which can also be specified as the
                            first free parameter on the command line (no need
                            for the --data option). This is a simple ascii
                            multi-column file, see --using. Use the special
                            name - for stdin.
  -o [ --output ] arg       The output files base name, which can also be
                            specified as the second free parameter on the
                            command line (no need for the --output option). Two
                            SVG files are generated, one is base_name.svg for
                            the generated color map / vector field, and the
                            other is base_name_legend.svg for the associated
                            legend. The size of the generated image is set to
                            the number of distinct X and Y values. If this does
                            not suit your needs you may easily rescale the SVG
                            file in a SVG editor (tip: try Inkscape), or use
                            the zoom factor (see below). If this is not enough
                            you'll have to resample your data file before
                            passing it to this program.
  -u [ --using ] arg        Specify which columns to use for plotting, default
                            is 1:2:3 for a 3-column file, 1:2:3:4 for a
                            fourth-column file, and 1:2:3:4:5 otherwise. The
                            first value indicate which column holds the X
                            coordinates, the second value the Y coordinates.
                            The program assumes the X and Y data are regularly
                            spaced, possibly with missing values. If only three
                            values are specified a scalar color map is built.
                            If 4 values are specified a vector field is built
                            using the third and fourth values as the vector
                            coordinates at each X,Y position, and the color is
                            set according to the vector norm. If a fifth value
                            is given then it is used for building a scalar
                            color map, while fields 3 and 4 are still used as
                            vector coordinates for plotting the arrows on top
                            of that map.
  -x [ --xrange ] arg       The range of the X values, specified as min:max.
                            The default is to use the min and max in the file.
                            Data values outside this range are ignored.
  -y [ --yrange ] arg       The range of the Y values, specified as min:max.
                            The default is to use the min and max in the file.
                            Data values outside this range are ignored.
  -r [ --scalar_range ] arg The range of the scalar data, specified as min:max.
                            The default is to use the min and max in the file,
                            but you can specify a different range, for example
                            to have comparable colors across different figures.
                            Values outside the range are clamped to the
                            min/max.
  -a [ --arrows_range ] arg The range of the arrow lengths for the vector data,
                            specified as min:max. The default is to set the
                            arrow of a median normed vector to half the grid
                            size. Here min and max specify the norm below which
                            no arrow is displayed, and the norm above which the
                            arrow is clamped to the grid size, with the average
                            set to half the grid size. This option is mainly
                            useful to have comparable arrow lengths across
                            different figures
  -b [ --boundary_values ]  There is one pixel per value, regularly spaced.
                            Default is to set each value at a pixel center. If
                            this option is set, the data min and max correspond
                            to the left/low boundaries of the first and last
                            pixels.
  -z [ --zoom ] arg         If set, each value in the data file is duplicated
                            that many times along the X and Y directions. This
                            effectively enlarges pixels. Only integer values
                            are allowed, no interpolation is performed, see
                            --output above.
  -c [ --config ] arg       If specified, add all parameters from this
                            configuration file in addition to the command-line
                            arguments. The file syntax is one option=value per
                            line, # are comments and blank lines are ignored.
                            In case of duplicated values, the command-line
                            arguments take precedence.
  -s [ --silent ]           Do not display warning messages.
  -h [ --help ]             Display this help
.